Which Internal Medicine Training Programs Are Interviewing the Most First-Year Resident Candidates, and Where?
March 2026
How Does the Ratio of Internal Medicine PGY-1 Candidate Interviews to Available PGY-1 Positions Differ by Program Type?
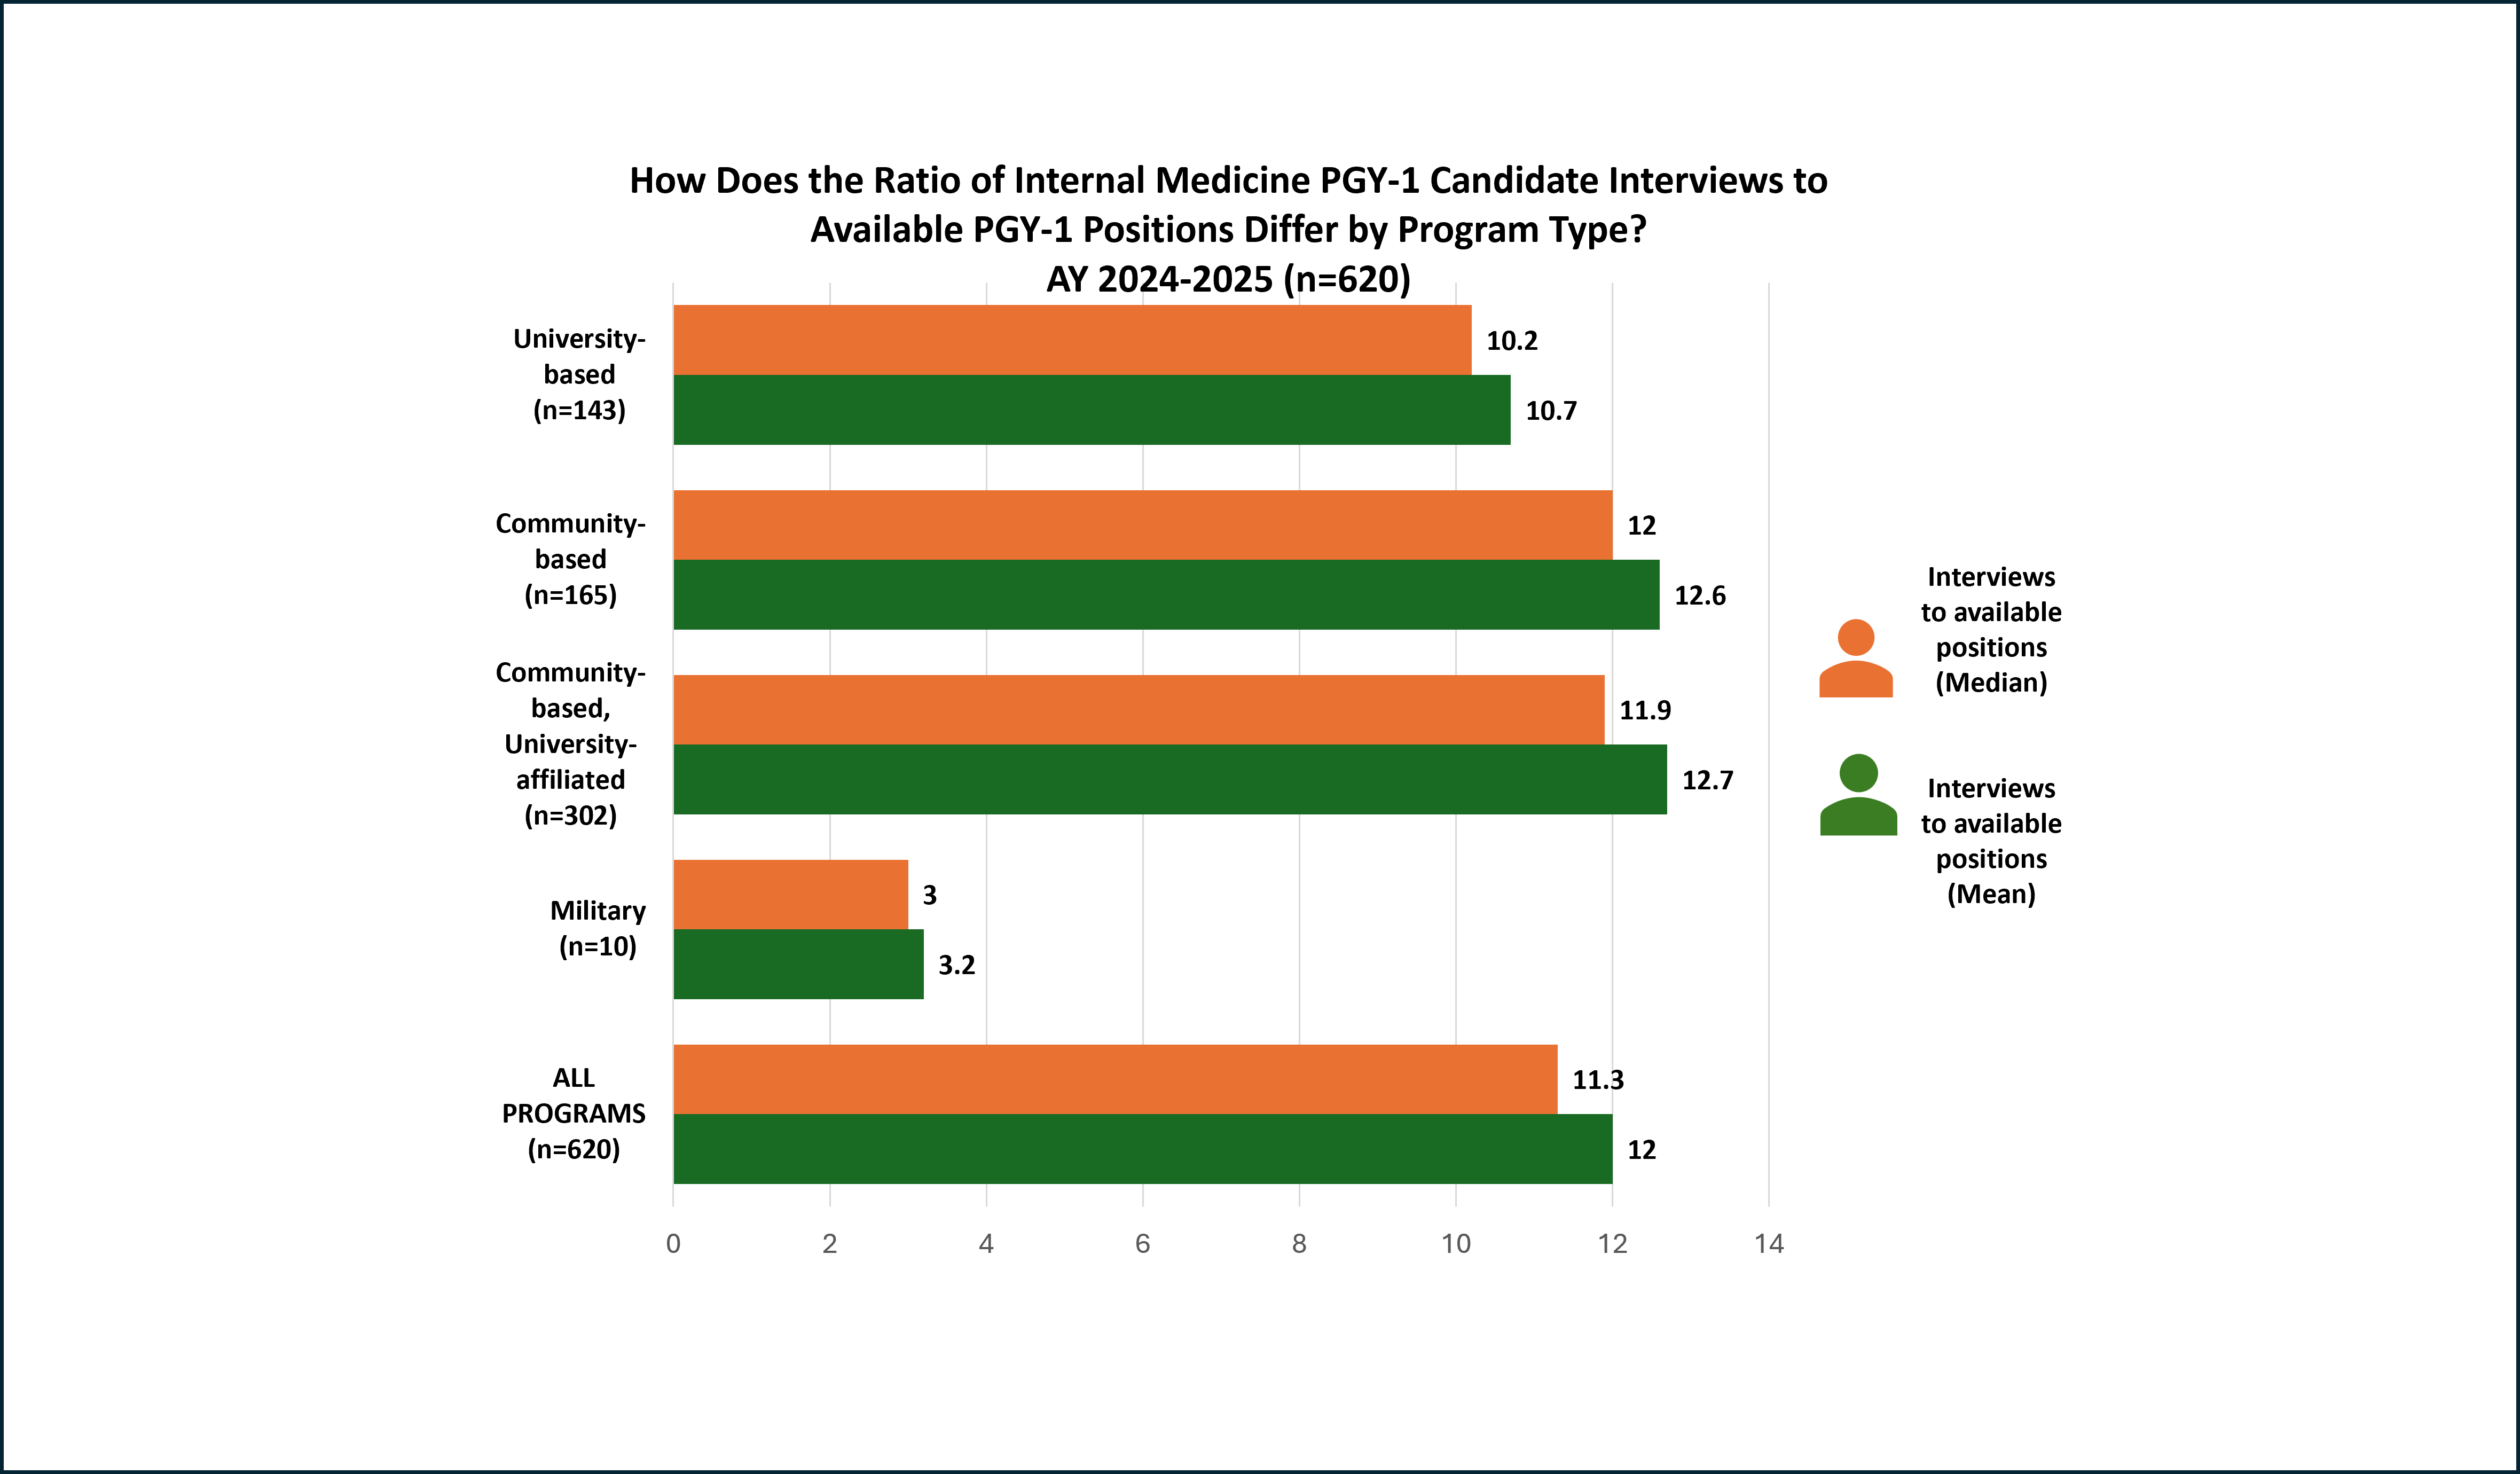
- Sources: 2025 APDIM Annual Survey of Internal Medicine Residency Program Directors. Program type, number of interviews, and number of positions obtained from American Medical Association (AMA) Residency & Fellowship Database®.
- Study criteria: All internal medicine residency programs of 1. “Continued” or “initial” Accreditation Council for Graduate Medical Education accreditation status prior to July 1, 2024 (not 2025), that 2. Filled at least one approved position. 631 programs met those criteria; n=620, however, because data were not available for 11 programs. Note: PGY-1=Postgraduate Year.
- Kruskal-Wallis equality-of-populations rank test (1 degree of freedom; adjusted for ties) between “University-based” and all other program types: p<0.001.
The Ratio of Internal Medicine PGY-1 Candidate Interviews to Available PGY-1 Positions Varies by Census Division
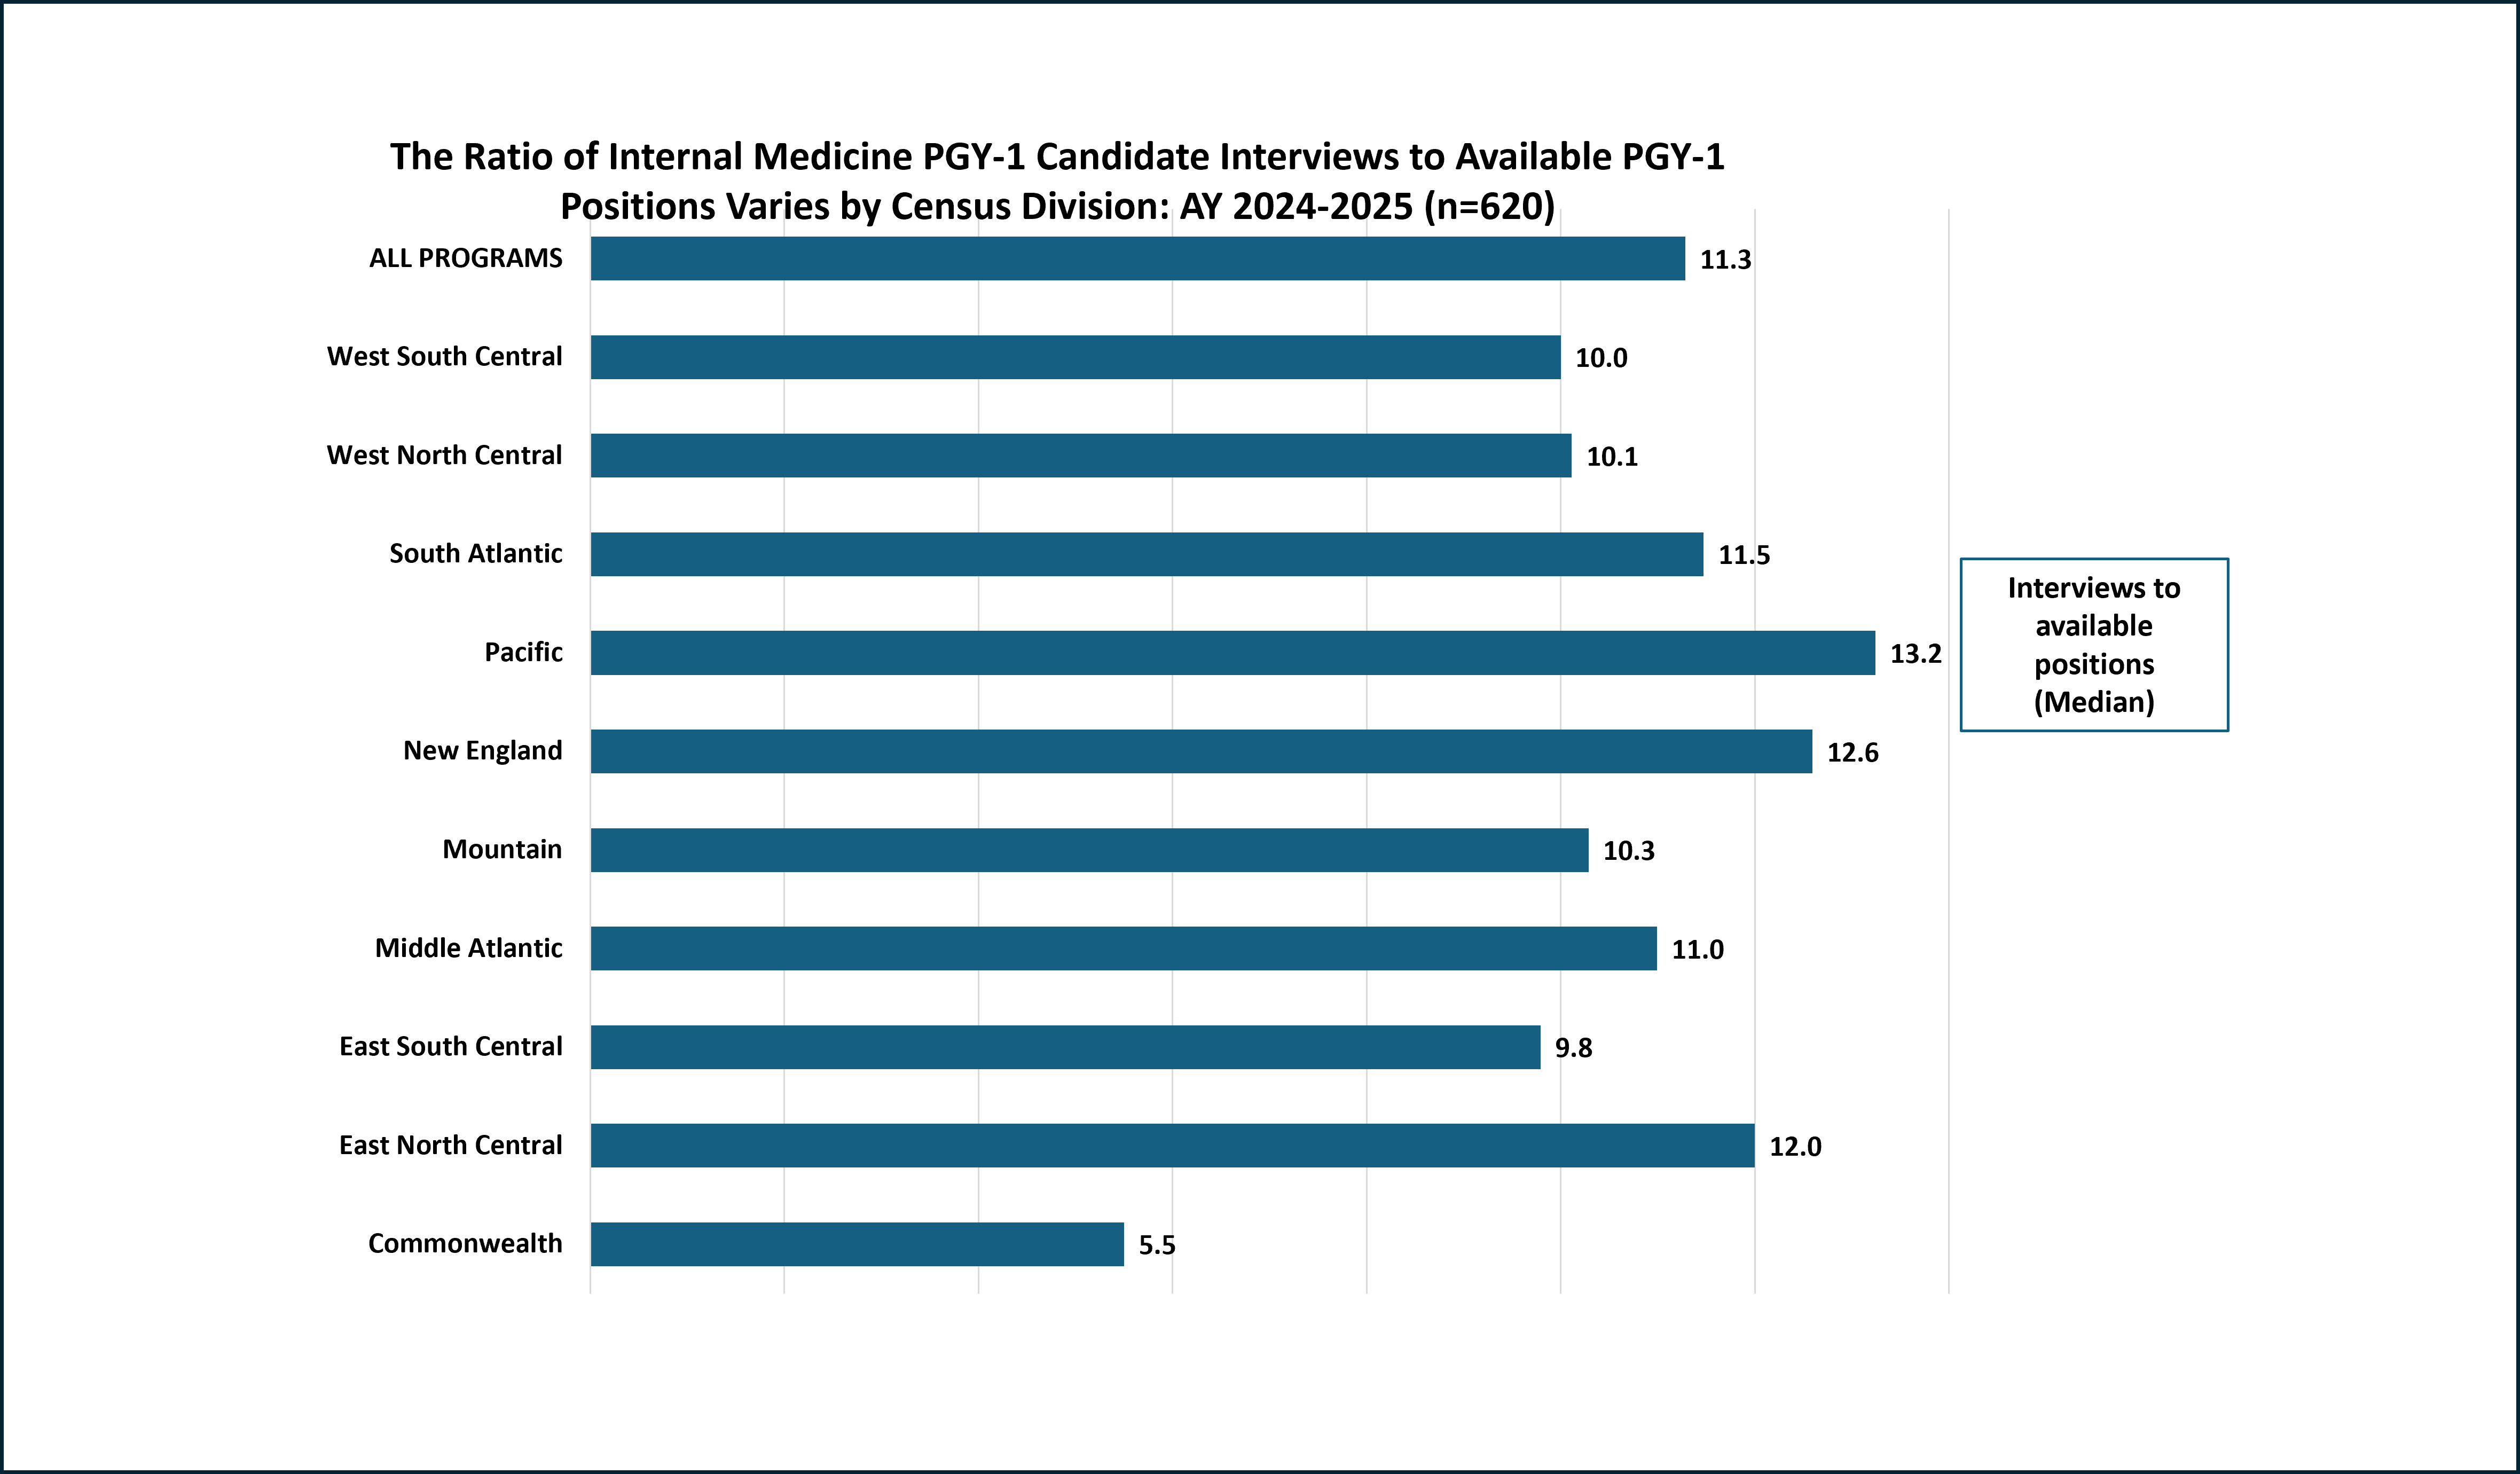
- Sources: 2025 APDIM Annual Survey of Internal Medicine Residency Program Directors. Program type, number of interviews, and number of positions obtained from American Medical Association (AMA) Residency & Fellowship Database®.
- Study criteria: All internal medicine residency programs of 1. “Continued” or “initial” Accreditation Council for Graduate Medical Education accreditation status prior to July 1, 2024 (not 2025), that 2. Filled at least one approved position. 631 programs met those criteria; n=620, however, because data were not available for 11 programs. Note: PGY-1=Postgraduate Year.
- Kruskal-Wallis equality-of-populations rank test (9 degrees of freedom; adjusted for ties): p<0.001.
Data in Brief highlights key results gathered by recent Alliance research surveys. Watch for an email with new featured results.
This month's Data in Brief compares the number of PGY-1 candidates interviewed to the number of available first-year positions for training programs accredited as of Academic Year 2024-25. Overall, the ratio of interviews to available positions varied, with a mean of 12.0, a median of 11.3, and a standard deviation of 5.0. University-based programs conducted slightly fewer interviews to available positions (median of 10.2), compared to all other program types (median of 11.9; p<0.001). Finally, interviews to positions varied noticeably by geographic location, where ratios were highest among programs in the Pacific and New England Census Divisions (p<0.001).
Contact surveys@im.org if you have any questions about the results below or any of the annual surveys.
Latest Data in Briefs
-
Another Look at “Second Looks” from the AY 2025 Internal Medicine Recruitment Cycle
July 2026
-
Measuring Differences in Wellbeing for Internal Medicine Educators and Administrators
May 2026
-
Which Internal Medicine Training Programs Are Interviewing the Most First-Year Resident Candidates, and Where?
March 2026
Privacy Policy |
Terms of Use |
Contact Us
330 John Carlyle Street | Suite 610 | Alexandria, VA 22314 | P: (703) 341-4540
© Alliance for Academic Internal Medicine. All Rights Reserved.
Web Design & Development by Matrix Group International, Inc.
.tmb-medium.png?Culture=en&sfvrsn=44351355_1 "even-better-together-w-swirl-(alt)")